QR Code Statistics 2026: Every Number Sourced
QR codes generate two contradictory headlines at once: consumers say they are tired of them, yet the technology keeps embedding itself deeper into payments, retail, and fraud. This page collects the QR code statistics that actually check out. Every number below links to a primary source, we fetched each one, and we re-verify the whole page every quarter. Where the sources disagree, we show you both figures instead of picking the prettier one.
QR codes in 2026: the headline numbers
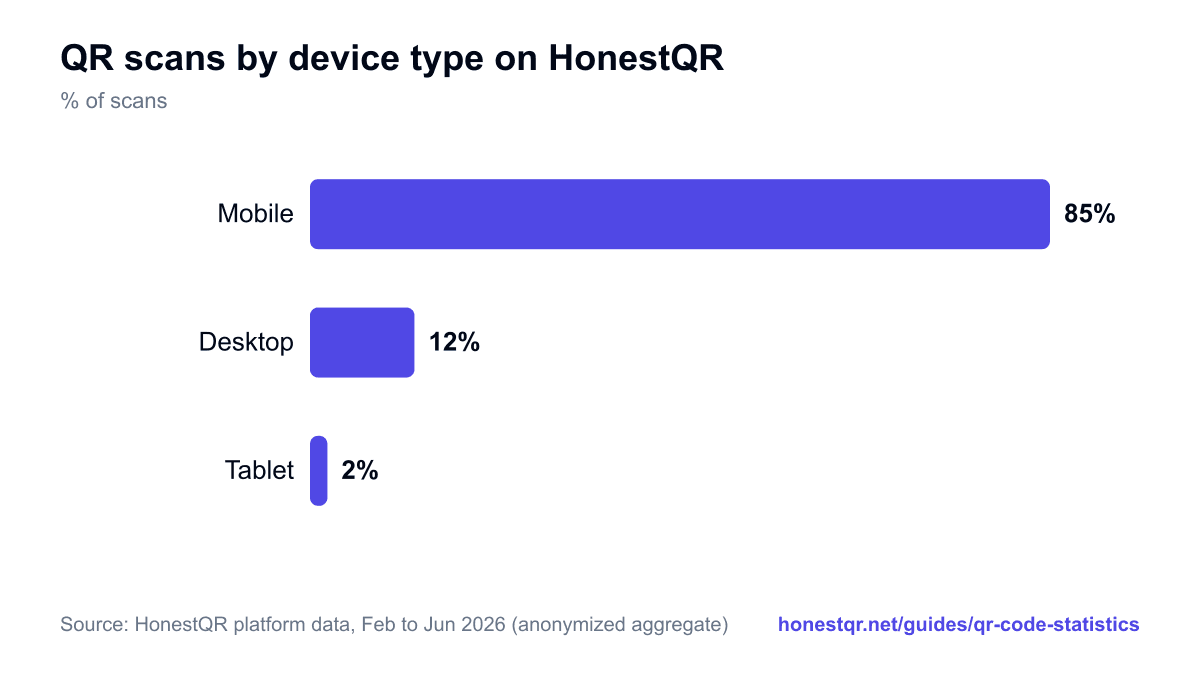
On HonestQR, 85% of QR code scans happen on mobile devices. QR is a phone-first medium, and our own scan data further down this page reflects that almost completely.
eMarketer forecast that nearly 100 million Americans would scan a QR code in 2025, up from 83.4 million in 2022. That is the clearest growth curve in the consumer data.
People aged 35 to 54 scan QR codes more often than 18 to 34 year olds, according to GWI's 2024 data. That is the opposite of the youth-first story most QR pages tell.
Coinbase's bouncing QR code drew more than 20 million landing-page hits in one minute during the 2022 Super Bowl and crashed its own app, according to Coinbase's own teardown with Branch.
90% of American diners now say they prefer paper menus to QR codes, up from 74% a year earlier, in US Foods' 2024 survey. The pandemic-era menu code has worn out its welcome.
India's UPI network processed 23.2 billion transactions worth about 312 billion dollars in May 2026 alone, according to NPCI data.
India deployed 657.9 million UPI payment QR codes in a single year, a 91.5% jump, according to the Reserve Bank of India.
QR code payments are forecast to reach 5.4 trillion dollars in 2025 and exceed 8 trillion dollars by 2029, according to Juniper Research.
QR-code email attacks jumped 146% in a single quarter, from 7.6 million in January 2026 to 18.7 million in March, Microsoft Threat Intelligence reported.
UK victims lost almost 3.5 million pounds to fraudulent QR codes in one year across 784 reports, according to Action Fraud.
QR code adoption and usage statistics
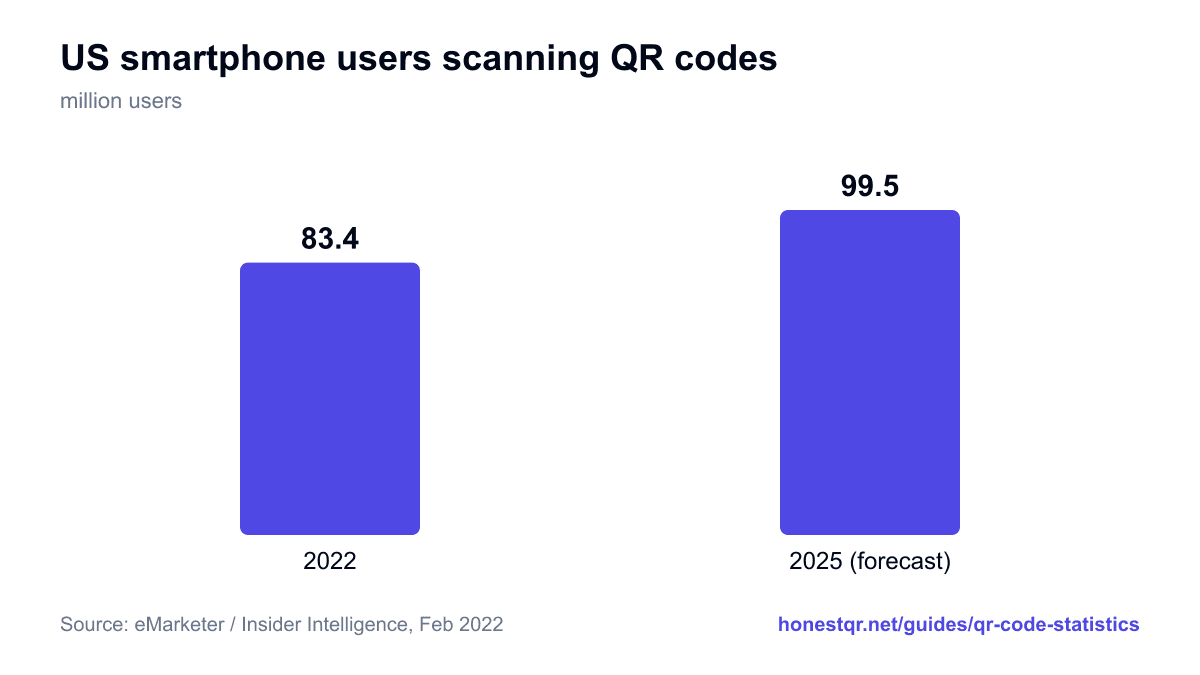
The clearest adoption data comes from the United States. eMarketer's February 2022 forecast put US smartphone users scanning a QR code at 83.4 million in 2022, climbing to a projected 99.5 million by 2025. In share terms, that is 42.6% of US smartphone users scanning at least one code by 2025, on an 8.7% compound annual growth rate from 2020.
The numbers are not perfectly clean, and we will not pretend otherwise. A later industry estimate quoted in a US Census Bureau working paper put US QR scanners at 89 million in 2022, up 26% year on year, which sits well above eMarketer's 83.4 million forecast for the same year. Both figures are in the table below. When sources this credible disagree, the honest move is to show the range, not average it into false precision.
The demographic picture is the real surprise. GWI's 2024 data, summarized by DataReportal, found that people aged 35 to 54 are more likely to interact with QR codes than 18 to 34 year olds. QR scanning skews slightly older than the youth-first cliche suggests, which matters if you are deciding where to place a code.
| Statistic | Value | Year | Source |
|---|---|---|---|
| US smartphone users scanning QR codes | 83.4 million | 2022 | https://www.emarketer.com/content/qr-codes-forecast-trends-2022 |
| US QR scanners (forecast) | 99.5 million | 2025 | https://www.emarketer.com/content/qr-codes-forecast-trends-2022 |
| Share of US smartphone users scanning | 42.6% | 2025 | https://www.mediapost.com/publications/article/371193/834-million-us-smartphone-users-will-scan-qr-co.html |
| US scanners (revised industry estimate) | 89 million, up 26% | 2022 | https://www2.census.gov/library/working-papers/2024/adrm/cbsm/rsm2024-05.pdf |
| Most active age group | 35 to 54 year olds | 2024 | https://datareportal.com/reports/digital-2024-october-global-statshot |
QR code payment statistics
If consumer novelty is cooling, payments are where QR became infrastructure. Juniper Research forecasts the value of QR code payments at 5.4 trillion dollars in 2025, rising past 8 trillion dollars by 2029, a jump of roughly 50%.
India is the clearest example. Its UPI network processed 23.2 billion transactions worth 312.21 billion dollars in May 2026 alone, per NPCI data via IBEF, and the Reserve Bank of India reported 657.9 million UPI payment QR codes deployed in a single year, up 91.5%. The IMF has recognized UPI as the world's largest real-time retail payment system.
China is the other giant. Online payment users there passed 1 billion by the end of 2024, according to CNNIC. Chinese mobile payment is overwhelmingly QR-led, so treat that as a proxy for QR reach rather than a direct count of QR users.
One number to handle with care: Juniper's forecast that global QR payment users would exceed 2.2 billion. That is a 2021 forecast, not a measured headcount, and figures this large are always projections. We keep it because it is still the most-cited global user estimate, but we label it as the forecast it is.
| Statistic | Value | Year | Source |
|---|---|---|---|
| UPI transactions in a single month | 23.2 billion, USD 312.21B | May 2026 | https://www.ibef.org/news/upi-transactions-soar-to-record-us-312-21-billion-in-may |
| UPI payment QR codes deployed | 657.9 million, up 91.5% | 2024 to 2025 | https://ddnews.gov.in/en/upi-qr-codes-record-91-5-surge-to-657-9-million-credit-card-growth-slows/ |
| Global QR payment value | USD 5.4 trillion | 2025 | https://www.juniperresearch.com/press/qr-code-payments-to-exceed-8tn-by-2029/ |
| Global QR payment value (forecast) | USD 8 trillion | 2029 | https://www.juniperresearch.com/press/qr-code-payments-to-exceed-8tn-by-2029/ |
| Global QR payment users (2021 forecast) | 2.2 billion | 2025 | https://financialit.net/news/payments/qr-code-payment-users-reach-22-billion-globally-2025-services-expand-beyond-china |
| China online-payment users | over 1 billion | end 2024 | https://english.www.gov.cn/archive/statistics/202501/18/content_WS678ae7f6c6d0868f4e8eef08.html |
QR codes in marketing: what the honest data shows
QR marketing has a boom-and-backlash shape, and both halves are true.
The boom peaked at the 2022 Super Bowl, when Coinbase ran an ad of nothing but a bouncing QR code. It drew more than 20 million landing-page hits in a minute and crashed the Coinbase app under the load, on a spend Coinbase put at 14 million dollars. It became the case study everyone cited for QR's arrival.
The backlash is now just as measurable. In connected-TV advertising, QR scan rates fell from 0.010% in the first half of 2025 to 0.004% by the fourth quarter, per EMARKETER data citing BrightLine. The interest is there in principle: a 2022 Sharethrough survey of 1,000 US viewers found 76% would scan a QR code in a relevant TV ad and 79% already use their phone during ad breaks. Turning that intent into actual scans is the hard part.
The menu is where the fatigue shows most. US Foods' 2024 survey of 1,005 US diners found 90% now prefer paper menus, up from 74% in 2023. The generational detail defies expectations: 90% of Gen Z prefer paper, up from 69%, and 95% of Boomers, up from 86%. For contrast, Datassential's earlier 2021 to 2022 data on menu-specific QR use put it at 68% for Gen Z, 78% for Millennials, 51% for Gen X and 22% for Boomers. Different measure, earlier moment: together they show a genuine reversal in menu behavior, not a contradiction.
Structural adoption, though, keeps moving the other way. Under GS1's Sunrise 2027 initiative, retailers and brands are migrating product barcodes from one-dimensional UPC symbols to two-dimensional formats that include QR. Sunrise 2027 is a target date and an industry milestone, not a legal mandate, so treat any coverage that calls it a requirement with suspicion.
QR code security: quishing statistics
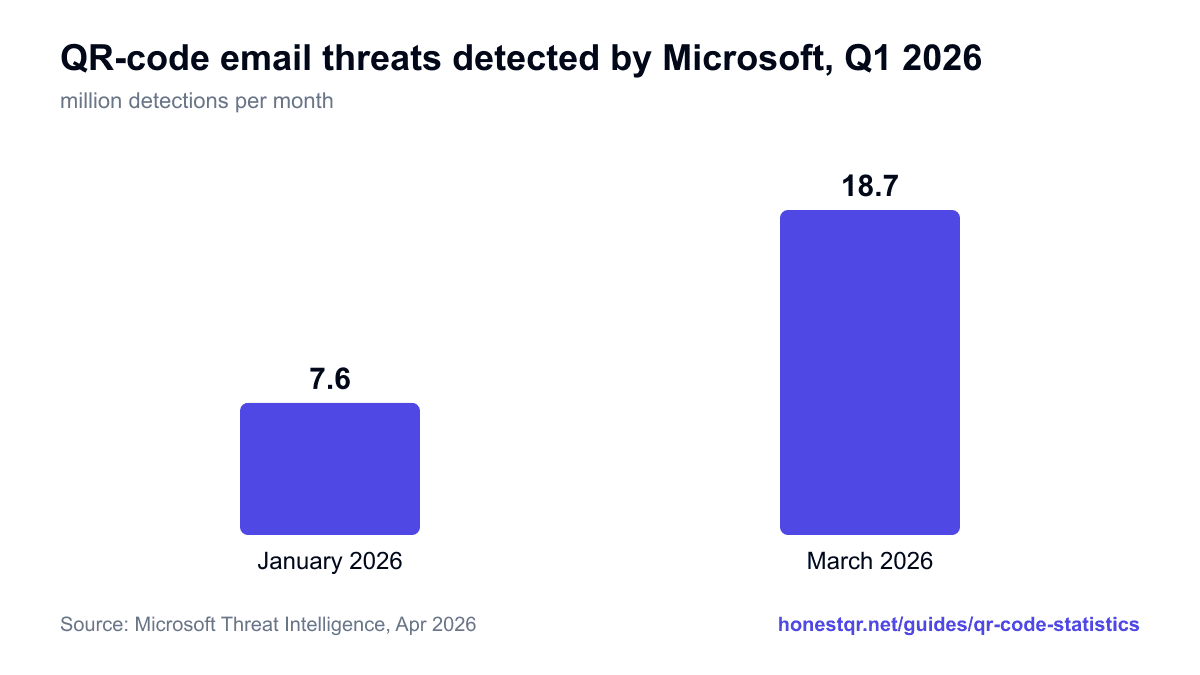
The fastest-moving QR statistics right now are about abuse. Microsoft Threat Intelligence called QR-code phishing, or quishing, the fastest-growing email attack vector of the first quarter of 2026, with detections up 146% in a single quarter, from 7.6 million in January to 18.7 million in March. Most of it hides in attachments: PDF files carried 65% to 70% of these QR attacks, while QR codes embedded directly in email bodies surged 336%, though that tactic is still around 5% of volume.
The targeting is deliberate. Abnormal Security found that C-suite executives are 42 times more likely to receive a QR phishing attack than the average employee, and that 89.3% of QR-code attacks are credential phishing aimed at stealing logins. Palo Alto Networks' Unit 42 reported more than 11,000 malicious QR detections per day, with roughly 15% of QR-bearing pages leading to malicious links. Unit 42 also tracked QR-driven traffic to URL shorteners rising 55% from the first half of 2023 to the first half of 2024, then another 44% the following year, as attackers use shorteners to mask their destinations.
The losses are real. In the UK, Action Fraud logged 784 quishing reports and almost 3.5 million pounds in losses between April 2024 and April 2025. In the US, the FBI's IC3 issued a public alert in July 2025 about scams using QR codes in unsolicited packages. The practical defense has not changed: check where a code actually points before you enter credentials or payment details, and be suspicious of stickers placed over printed codes.
What our own platform data shows
We run a QR platform, so we can add one honest first-party datapoint instead of recycling someone else's. These figures come from anonymized, aggregated scan events on HonestQR between February and June 2026, published as percentages only.
Scanning is overwhelmingly a phone activity. Mobile devices account for 85% of scans on HonestQR, desktop for 12%, and tablets for 2%. Those scans came from 49 countries, which lines up with QR being a global, phone-first medium rather than a regional one. Because these scans run through dynamic QR codes, the redirect keeps logging long after the artwork is printed.
We publish shares by design. Raw scan and code counts would be a vanity metric and would tell you nothing useful, so this page keeps to percentages. Our QR codes that don't expire mean the scan record accumulates over years, not weeks, and you can create the same kind of trackable code with our free QR code generator.
iOS vs Android: what we see
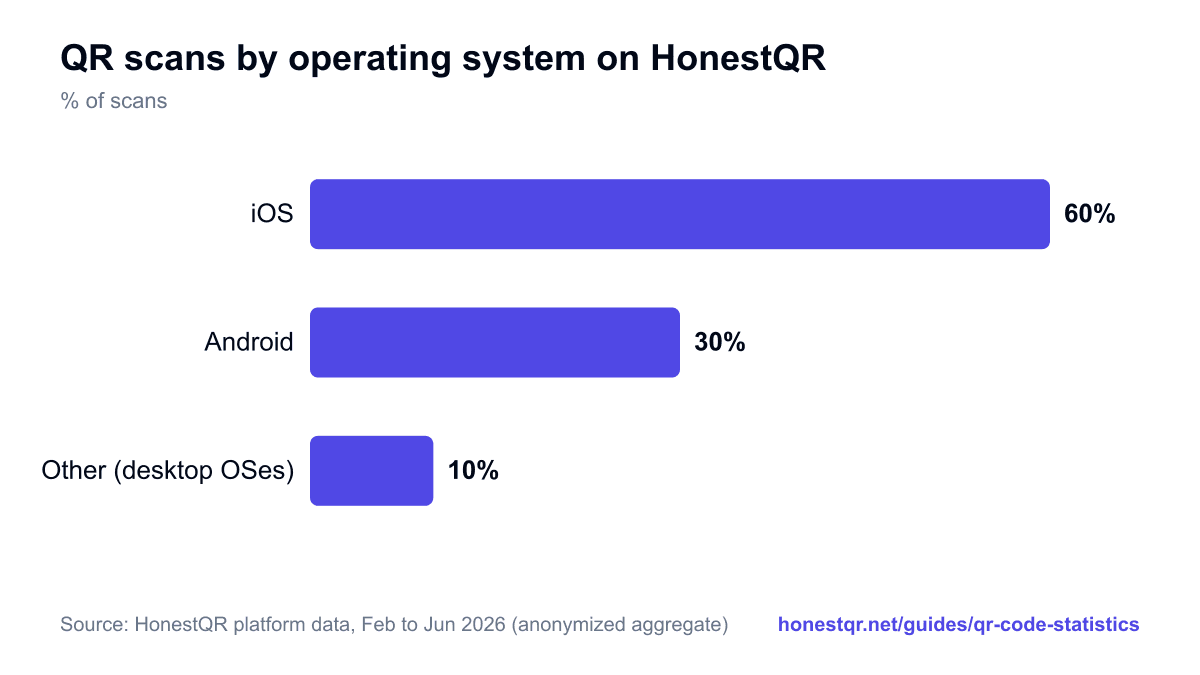
Break the same scans down by operating system and iOS leads: about 60% of scans on HonestQR come from iOS, 30% from Android, and the remaining 10% or so from other platforms. Roughly six in ten scans land on an iPhone.
We flag one honest gap here. There is no credible third-party source for how iOS and Android users differ in QR scanning behavior. The platform splits quoted around the web do not trace to a real study. So we offer our own split as the only sourced datapoint we know of on the question, with the caveat that it reflects traffic across codes made on HonestQR, not the whole internet. If you see a confident global iOS-versus-Android scanning statistic elsewhere, ask where the underlying data actually came from.
QR code market size forecasts
Market-sizing reports are the least reliable QR statistics, because every firm draws its boundaries differently, so we present them as a labeled range rather than a single truth. Read every row below as a vendor forecast.
The base years cluster between about 12.5 and 18.6 billion dollars, and most projected growth rates land between 16% and 20% a year, with one clear outlier at 36%. Take those two facts, not any single headline, as the honest summary. The spread itself is the story: nobody actually knows the number to two decimal places, however precisely these reports quote it.
| Report | Base value / year | Forecast value / year | CAGR | Source |
|---|---|---|---|---|
| QR codes market (Mordor Intelligence) | USD 13.04B (2025) | USD 33.14B (2031) | 16.82% | https://www.mordorintelligence.com/industry-reports/qr-codes-market |
| QR code labels market (Future Market Insights) | USD 1.8B (2025) | USD 4.1B (2035) | 8.7% | https://www.futuremarketinsights.com/reports/qr-code-labels-market |
| QR payment market (Grand View Research) | USD 12.54B (2024) | USD 61.73B (2033) | 20.0% | https://www.grandviewresearch.com/industry-analysis/qr-code-payment-market-report |
| QR payment market (Future Market Insights) | USD 18.6B (2026) | USD 85.6B (2036) | 16.50% | https://www.futuremarketinsights.com/reports/qr-code-payment-market |
| QR payment technologies (Data Bridge, outlier) | USD 15.35B (2024) | USD 179.81B (2032) | 36.01% | https://www.databridgemarketresearch.com/reports/global-quick-response-qr-code-payment-technologies-market |
Where QR codes came from
The QR code is not new. It was invented in 1994 by the Japanese company Denso Wave, with development led by engineer Masahiro Hara, originally to track automotive parts moving through a factory. The design goal was a code that could be read quickly from any angle and still scan when partly damaged, which is exactly why it later survived being printed on menus, packaging, and payment terminals. Denso Wave keeps a short official history at https://www.qrcode.com/en/history/.
Methodology: how these statistics were verified
Every statistic on this page was verified the same way. We fetched each source URL, confirmed the number appears on the page we link, and graded it: A for primary or authoritative sources, B for reputable secondary sources and carriers, and C for vendor marketing, which we label wherever we use it. Anything we could not confirm on a live page was left off, however tempting the number.
This page was last verified on 2 July 2026, and we re-verify the whole thing quarterly: every statistic is re-checked against its source, dead links get replaced or removed, and the last-verified date moves with each pass. To cite it, use: HonestQR QR Code Statistics, honestqr.net/guides/qr-code-statistics.
We show source conflicts rather than hiding them. eMarketer forecast 83.4 million US scanners for 2022 while a later industry estimate put the figure at 89 million, and we list both. Juniper's 2022 report forecast 3 trillion dollars in QR payment value for 2025, which its 2025 report revised up to 5.4 trillion, so we cite the current figure and note the revision.
We also decline stats that do not hold up, which is most of the traffic in QR listicles. We do not publish the widely-copied claim that a Pew Research survey found 87% of 18 to 29 year olds have scanned a QR code, because Pew ran no such survey and the citation is fabricated across dozens of pages. We drop the recycled growth claims (the 89% growth from 2018 to 2020 figure and its 400% cousins) that trace only to other listicles, MobileIron's 86.66% scanned figure whose original report is dead, Egress's claim that 12% of phishing contains a QR code whose source page no longer resolves, and the various TV-scan-rate claims attributed to firms like TiVo and Nielsen that appear only in search snippets with no fetchable page behind them. If a number matters and we cannot stand behind its source, it is not here.
Frequently Asked Questions
What percentage of people scan QR codes?
In the US, eMarketer forecast that 42.6% of smartphone users would scan a QR code by 2025, up from 83.4 million users in 2022. Globally there is no single credible figure, but usage data from GWI shows QR interaction is common across all age groups, with 35 to 54 year olds the most active scanners.
How many people use QR codes in 2026?
eMarketer forecast about 99.5 million US smartphone users scanning QR codes by 2025, and Juniper Research forecast more than 2.2 billion QR payment users globally. Numbers this large are forecasts rather than counts, which is why this page links every figure to its source.
Are QR codes growing or dying?
Both stories are true in different places. Consumer-facing novelty uses have cooled: 90% of US diners now prefer paper menus, and QR scan rates in TV ads fell during 2025. But QR as infrastructure keeps growing fast: India's UPI deployed 657.9 million payment QR codes in a single year, global QR payment value is forecast to pass 8 trillion dollars by 2029, and retail barcodes are migrating to 2D codes under GS1's Sunrise 2027 initiative.
Are QR codes safe to scan?
Mostly, but QR phishing (quishing) is growing quickly: Microsoft measured a 146% jump in QR-code email threats in one quarter of 2026, and UK victims reported almost 3.5 million pounds in losses in a year. Check where a code points before entering credentials or payment details, and be wary of stickers placed over printed codes.
What is the average QR code scan rate?
Honest answer: credible public benchmarks are scarce. Most 'average scan rate' numbers circulating online do not trace to a real source, so we do not publish them. The verified datapoints that exist are context-specific, like CTV ad scan rates of 0.004% to 0.010% in 2025. For your own campaigns, dynamic QR codes with scan tracking give you real numbers instead of industry guesses.
How often is this page updated?
Quarterly. Every statistic is re-verified against its source, dead sources get replaced or removed, and the last-verified date in the methodology section is updated. Statistics we cannot verify do not appear here.
Ready to create your QR code?
Free static QR codes with a free account. Go dynamic with scan tracking and a 7-day free trial.